
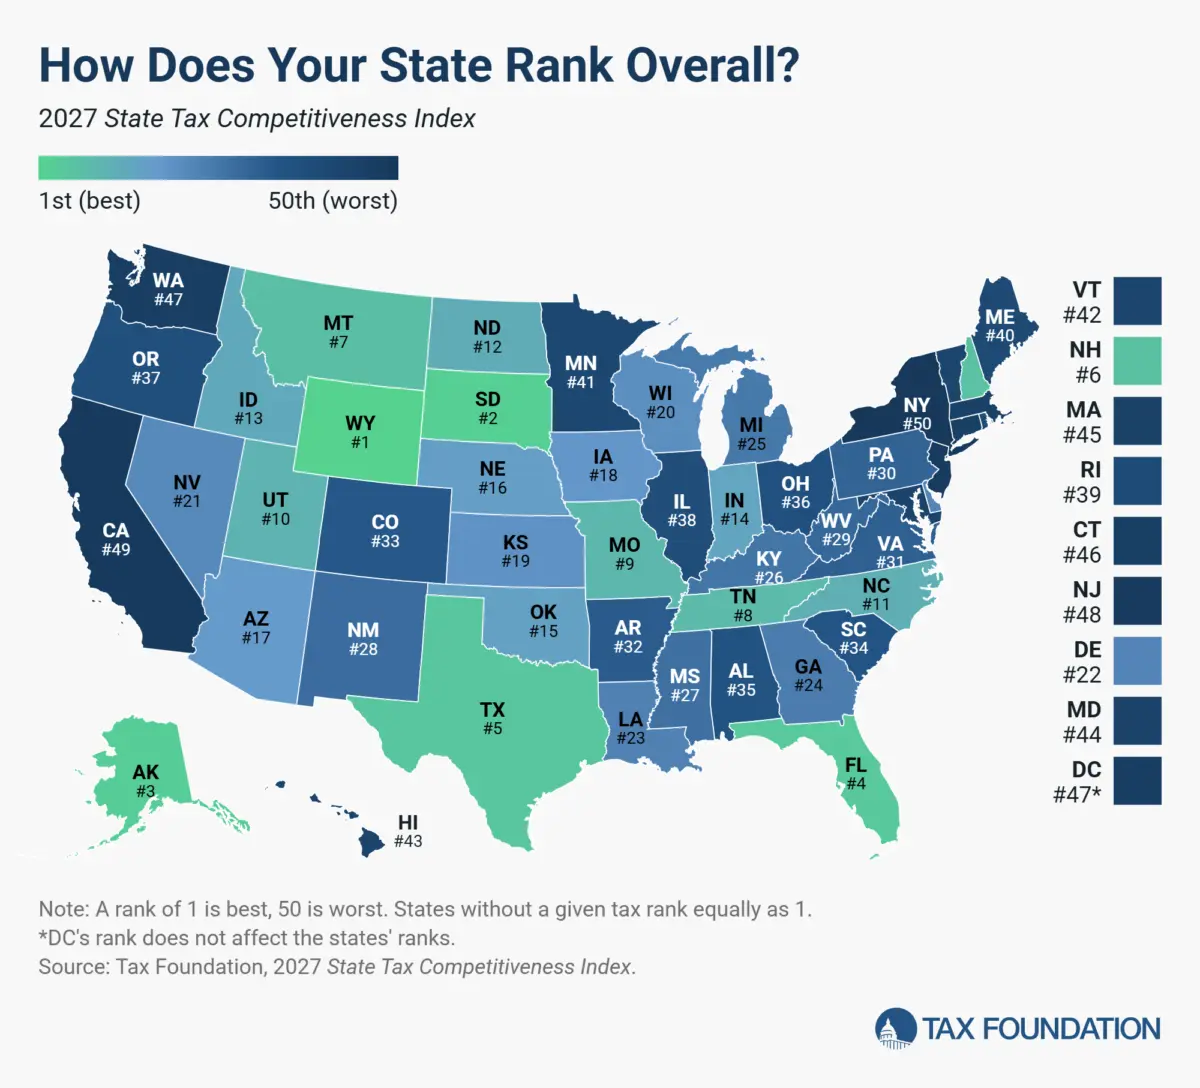
For more than two decades, policymakers and business leaders have relied on the Tax Foundation’s annual study to evaluate their tax codes and map out much-needed reforms. Originally published in 2003 as the State Business Tax Climate Index, the newly rebranded State Tax Competitiveness Index has undergone a comprehensive, ground-up redesign for its 2025 edition to better assess states’ overall tax competitiveness rather than focusing solely on the business climate.
According to Katherine Loughead, Vice President of State Policy at the Tax Foundation, the update was not merely an exercise in changing a title. The pace of legislative change has accelerated dramatically in recent years, driven by major developments such as the federal Tax Cuts and Jobs Act, the Supreme Court’s landmark Wayfair decision, the post-pandemic rise of remote work, and roiling unemployment insurance tax regimes. Furthermore, states have increasingly experimented with new or expanded taxes on wealth, unrealized gains, data, digital products, and digital advertising.
To address these modern fiscal realities comprehensively, the organization expanded the publication ahead of schedule to ensure it stays ahead of emerging tax trends. The revamped study introduces over 150 variables—which are now integrated into interactive, sortable, and filterable digital datasets rather than being hidden away in appendix tables. Each state now receives its own summary highlighting the notable features of its tax code, explaining its ranking, and offering state-specific reform recommendations.
Because of the extensive methodology updates, readers comparing this year’s rankings to editions from 2024 or earlier may notice more movement than usual. To ensure complete transparency and an apples-to-apples comparison, researchers have backcast state rankings under the new methodology going back seven years. These backcast rankings serve as the controlling baseline to accurately measure true state-level policy movement over time.
Understanding Tax Competition and the Top Performers
In public finance, tax competitiveness operates much like the sabermetric statistic WAR (Wins Above Replacement) in baseball. A well-structured tax code will not instantly transform a sparsely populated region into a bustling metropolis, nor will a poor tax structure turn a major financial hub into a ghost town. Nevertheless, tax structure plays a substantial role in economic success or failure.
Every state can benefit from a simple, neutral, transparent, and pro-growth tax structure. The Index evaluates states across five distinct subindices: corporate taxes, individual income taxes, sales and excise taxes, property and wealth taxes, and unemployment insurance taxes. Rather than assigning equal weights, the Index weights each subindex according to the variance across states in that category, placing greater emphasis on areas where states have the most room to compete.
A common thread among the top-ranked states in the Index is the absence of at least one major tax. Property and unemployment insurance taxes are levied nationwide, but several top performers forgo major revenue streams entirely. South Dakota and Wyoming levy neither corporate nor individual income taxes; Alaska and New Hampshire have no individual income or state-level sales taxes; Florida, Tennessee, and Texas have no individual income tax; and Montana levies no general sales tax.
However, avoiding a major tax is not the only path to success. States like Missouri and Utah demonstrate that a jurisdiction can levy all major tax types and still rank near the top of the Index by maintaining moderate rates and well-designed tax structures. Conversely, the lowest-ranked states in the Index typically share a common set of structural flaws: complex, nonneutral taxes paired with comparatively high rates. New Jersey, for example, is weighed down by some of the nation’s highest property tax burdens, the country’s highest corporate income tax rate, and a poorly structured individual income tax alongside an inheritance tax.
Key State Policy Shifts and Legislative Trends
A variety of legislative actions across the country have altered state standings in the latest Index. Several states experienced notable shifts due to their conformity—or lack thereof—with federal tax provisions, as well as structural rate adjustments.
Arizona saw its overall ranking slip from 14th to 17th, driven by timing issues regarding retroactive conformity legislation and a drop in its sales and use tax ranking following a three-year moratorium on tax incentives for new data center projects. Arkansas fell three spots to 32nd, impacted by ongoing nonconformity with federal full expensing allowances. Georgia dropped from 18th to 24th after declining to conform to competitive corporate expensing provisions and narrowing its individual income tax base by partially exempting tips and overtime pay.
Idaho and Indiana also slipped in the rankings after adopting temporary federal deductions for tips and overtime pay, which reduced state revenues without generating significant economic growth. Indiana’s individual income tax ranking fell from 21st to 28th, though the state maintained a strong property tax ranking following an increase in its tangible personal property tax exemption.
In contrast, Kansas improved four places to 19th overall, benefiting from rolling conformity with pro-growth business expensing provisions. Louisiana jumped from 32nd to 23rd, propelled by a 17-place improvement in its property tax rank due to the final phase-in of capital stock tax elimination. Missouri broke into the top 10, rising from 12th to 9th by adopting new federal expensing provisions while prudently resisting exemptions for tipped and overtime pay that would have narrowed its tax base.
Nebraska climbed eight spots to 24th to 16th, fueled by continued reductions in its individual and corporate income tax rates. Utah advanced to 10th overall by aligning with pro-growth federal expensing provisions and trimming its income tax rates, while its corporate tax rank improved seven places to 8th. Meanwhile, states like Maine and Washington faced downward pressure on certain components due to the adoption of high-income surcharges and new taxes on digital advertising and capital gains.
The Economic Impact of Tax Structure
The academic literature surrounding state taxation has increasingly converged on the consensus that taxes matter significantly for business decisions, economic growth, and location choices. While early post-World War II economic literature often dismissed the influence of taxes on business activity, subsequent empirical research over the past four decades has established that business decisions are heavily impacted by tax considerations.
Studies examining foreign direct investment, entrepreneurial entry, capital investment, and employment growth consistently find that high marginal tax rates, complex tax bases, and nonneutral levies act as drags on local economies. For instance, research demonstrates that corporate income taxes and personal property taxes exert statistically significant negative effects on employment growth and business start-ups. Because property taxes are assessed regardless of profitability, they can be particularly burdensome for young, growing firms that may not yet be profitable.
Furthermore, tax competition between states serves as an effective restraint on state and local tax burdens. When a state imposes significantly higher tax rates than its neighbors, mobile capital and labor migrate across borders, leading to lost economic activity, jobs, and revenue. Lawmakers aiming to foster long-term economic growth are repeatedly advised to pursue broad-based structural improvements rather than relying on targeted, ad-hoc tax incentives and subsidies, which often fail to deliver promised results while covering up an uncompetitive underlying tax climate.
As states continue to navigate shifting federal tax guidelines, remote work dynamics, and emerging digital economies, the State Tax Competitiveness Index provides policymakers with an essential diagnostic tool. By identifying structural strengths and weaknesses across more than 150 variables, the Index highlights the specific policy choices that position state tax codes for sustainable, long-term economic expansion.










No comments yet. Be the first to join the conversation!