
Medicaid and the Children’s Health Insurance Program (CHIP) continue to serve as fundamental pillars of the American healthcare safety net, providing essential health insurance and long-term care coverage to millions of low-income children, families, seniors, and individuals with disabilities. As jointly financed federal and state initiatives, these programs operate under a broad umbrella of federal regulations while granting individual states considerable flexibility in their administration. This structural design has resulted in a diverse patchwork of coverage landscapes nationwide, where eligibility rules, enrollment numbers, spending priorities, and demographic footprints vary dramatically from one state line to the next.
To help policymakers, researchers, healthcare advocates, and the public navigate this complex terrain, comprehensive new data resources have been released detailing the state-of-play for Medicaid programs across the country. These tools incorporate updated metrics tracking coverage percentages, total monthly enrollment figures, state expansion decisions, and broader demographic and economic indicators shaping local health policy. By examining these state-specific fact sheets, observers can gain a clearer understanding of how local political choices and population dynamics directly influence healthcare access for vulnerable residents.
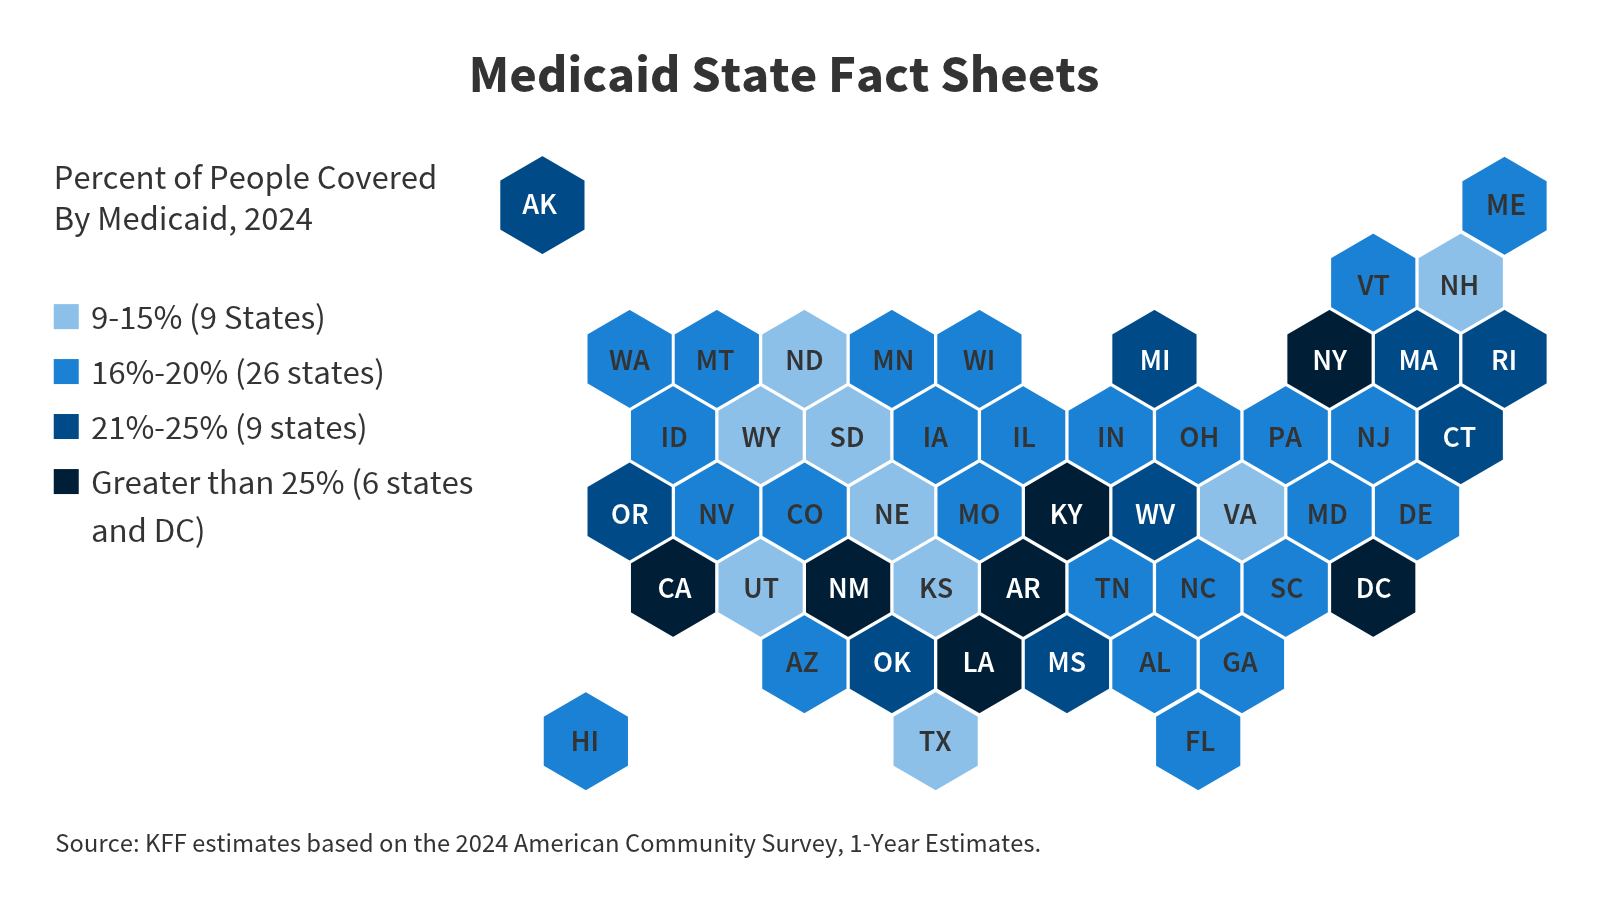
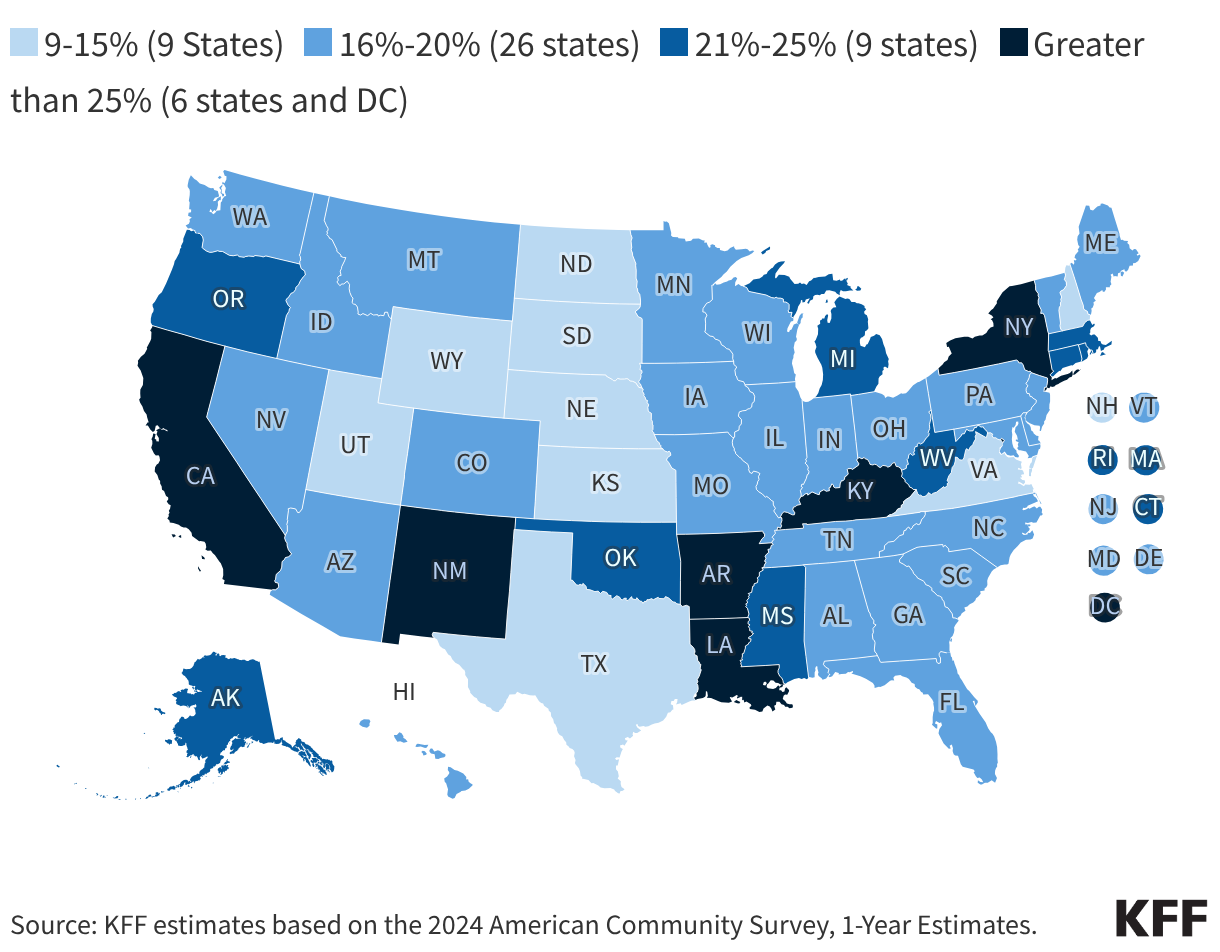
Percent of People Covered by Medicaid
The proportion of residents relying on Medicaid for their primary healthcare coverage differs significantly across the United States, driven largely by underlying demographic factors and policy decisions made at the state level. Choropleth maps and regional data releases for 2024 illustrate these disparities vividly, highlighting the varying degrees to which state populations depend on public health financing.
States that embraced the Affordable Care Act (ACA) Medicaid expansion generally exhibit higher overall coverage rates among low-income adults, as the policy broadened eligibility criteria well beyond traditional historical baselines. Conversely, in states that have chosen not to implement the expansion, coverage remains more restricted, often leaving a coverage gap for adults who earn too much to qualify for traditional Medicaid yet too little to afford private insurance plans on the ACA marketplaces. Beyond policy choices, differences in regional median incomes, age distributions, and local economic conditions further shape the percentage of residents enrolled in Medicaid and CHIP at any given time.
Accessing State-Specific Fact Sheets and Data
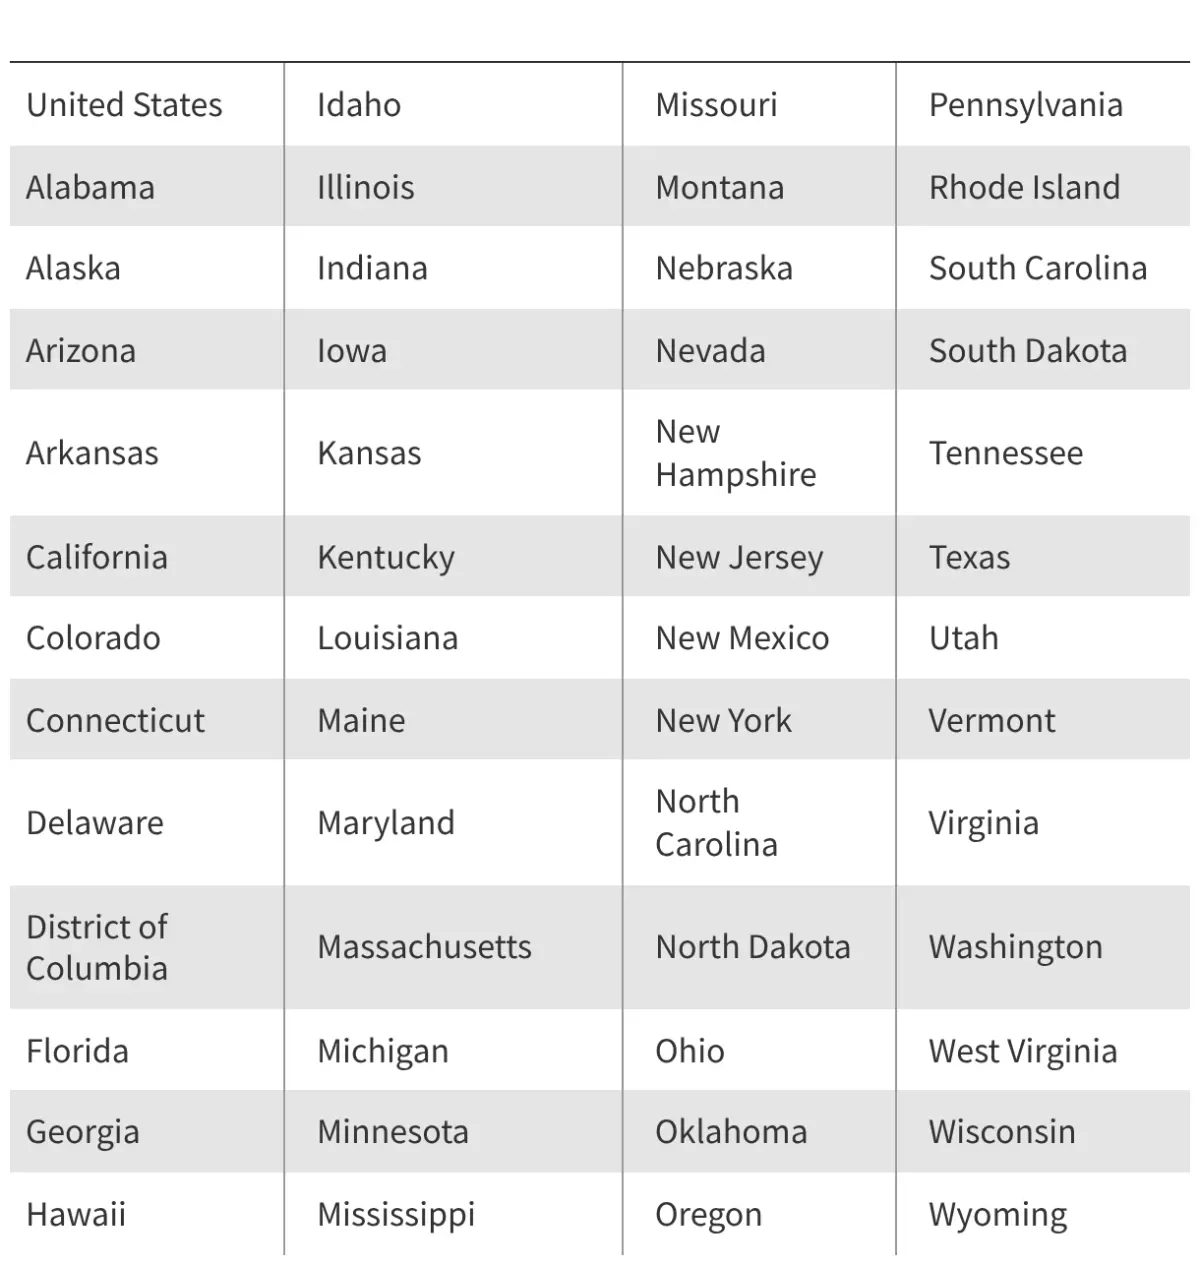
Understanding the localized impact of Medicaid requires granular data that looks beyond national averages. To facilitate this analysis, newly updated interactive tables and downloadable fact sheets provide a comprehensive snapshot of key metrics for every state in the union. These fact sheets serve as centralized repositories of vital information, allowing stakeholders to examine total enrollment trends, eligibility thresholds, and spending distributions on a state-by-state basis.
The availability of these detailed state profiles underscores the ongoing need for transparency in public healthcare financing. As states continuously adjust their administrative policies, manage redetermination processes, and adapt to shifting federal guidelines, having access to standardized, up-to-date data enables a more informed public discourse regarding the future of healthcare access and fiscal stewardship in the United States.
Sources and Methodological Foundation
The comprehensive data compiled within the state fact sheets draw from a robust collection of authoritative research sources and ongoing federal-state tracking mechanisms. These metrics synthesize both state-level realities and national benchmarks to provide an accurate overview of public health insurance dynamics.
Total monthly enrollment figures rely heavily on comprehensive tracking data maintained through state health policy databases, reflecting baseline participation trends leading up to mid-2026. These numbers capture the ebb and flow of program participation in the wake of pandemic-era policy unwinding and ongoing administrative shifts.
To understand how coverage translates to local communities, researchers also incorporate recent congressional district mapping analyses. These geographic tools illustrate Medicaid enrollment broken down by specific eligibility groups within federal legislative districts, offering a localized view of program dependency.
Further context is provided by tracking financial distributions, overall spending patterns, and the ongoing status of state-level ACA expansion decisions heading through 2026. Economic and demographic analyses are further enriched by integrating state health data on uninsured rates among residents aged zero to sixty-four, alongside median eligibility benchmarks that dictate who qualifies for assistance in various jurisdictions. Together, these foundational sources ensure that the state-by-state fact sheets provide an empirically grounded resource for evaluating the current state of Medicaid and CHIP nationwide.










No comments yet. Be the first to join the conversation!