
As millions of low-income children, families, and adults across the United States rely on public health insurance for essential medical and long-term care services, new data underscores just how drastically coverage and funding vary from one state to another. Medicaid and the Children’s Health Insurance Program (CHIP) serve as the bedrock of the nation’s social safety net, providing vital healthcare access to vulnerable populations. However, because these critical programs are jointly financed by the federal government and individual states while being administered locally under broad federal guidelines, the resulting landscape is one of striking geographical inequality.
Recent resources released to the public, including detailed interactive maps and comprehensive fact sheets, provide an in-depth look at Medicaid participation rates, spending distributions, and policy decisions across the nation in 2024. These tools reveal that a resident’s access to healthcare, the breadth of services available to them, and the financial investment made by their local government depend heavily on the state they call home.
Understanding the Patchwork of State Medicaid Programs
The fundamental structure of Medicaid inherently creates a diverse array of programs nationwide. While the federal government establishes overarching rules and provides a significant portion of funding—matching state expenditures based on a formula tied to average per capita income—states retain substantial autonomy. They decide specific administrative approaches, determine precise provider reimbursement rates, and choose whether to implement key provisions of federal healthcare legislation.
These state-level policy decisions drive wide variations in program breadth. Most notably, the choice of whether or not to adopt the Affordable Care Act’s (ACA) Medicaid expansion has created a stark divide. States that adopted the expansion have extended coverage to millions of low-income adults who previously fell into a coverage gap, earning too much for traditional Medicaid but too little to afford private insurance on the marketplace. Conversely, in states that have chosen not to expand, eligibility thresholds for non-disabled adults often remain extremely restrictive.
Beyond expansion decisions, states also possess the flexibility to set their own income eligibility limits above federal minimum standards for specific targeted groups, such as pregnant women, children, and individuals with disabilities. Coupled with the distinct demographic characteristics of each state—including age distribution, average household income, and regional health trends—these factors ensure that no two state Medicaid programs operate in exactly the same manner.
Examining Coverage Rates and Regional Trends Across the Country
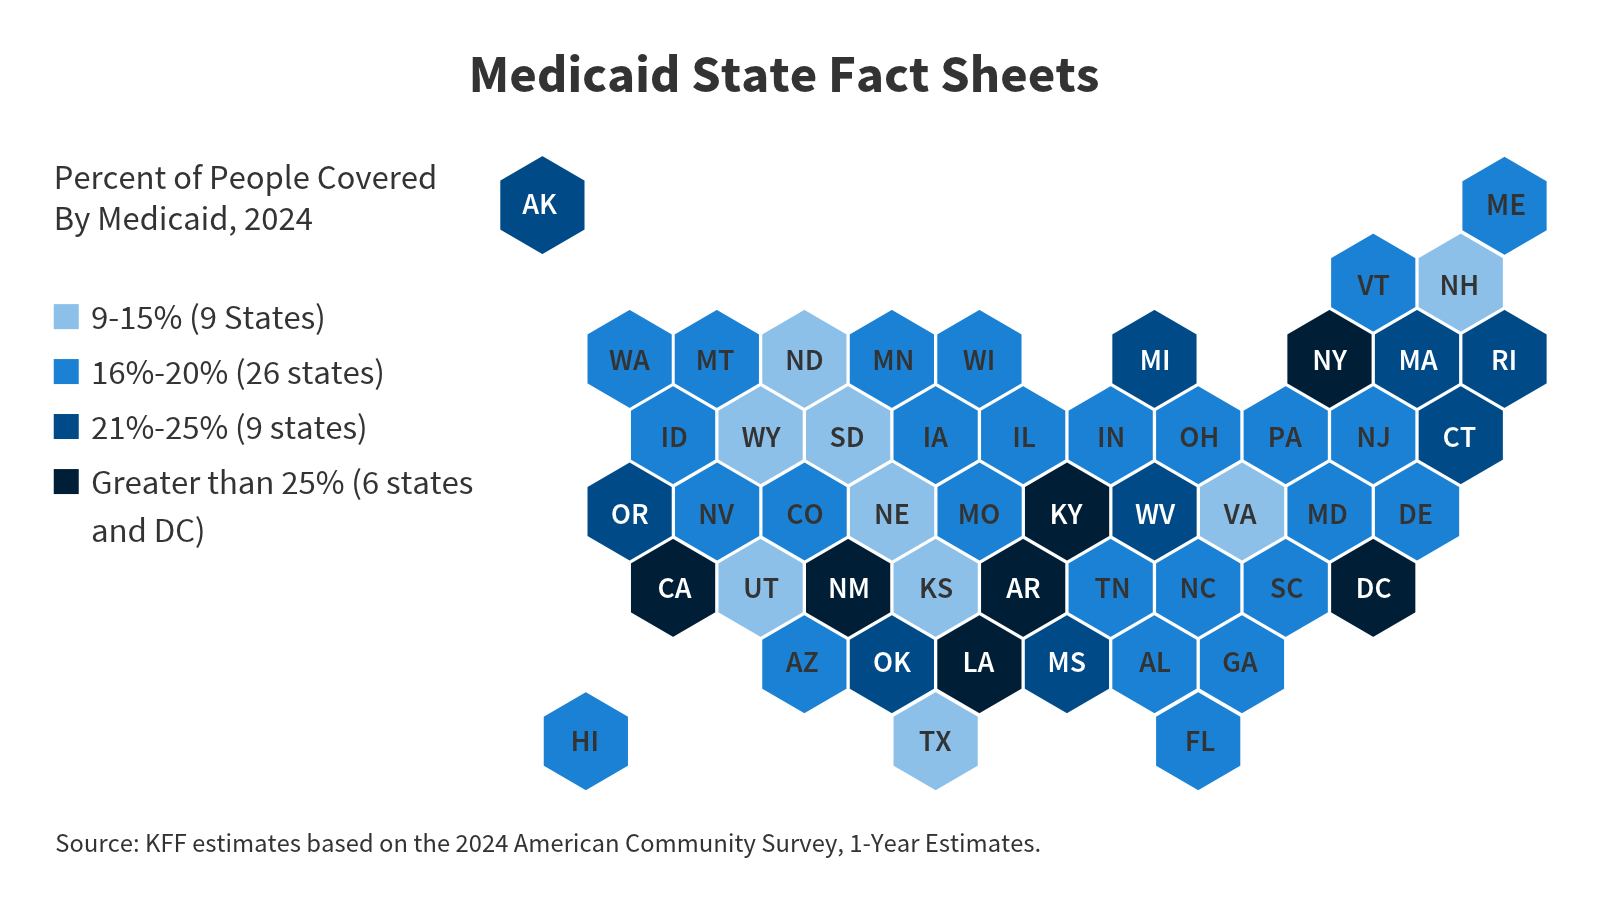
The national data highlights the percentage of people covered by Medicaid in 2024, utilizing choropleth maps and state-level datasets to illustrate geographic concentrations of public health insurance reliance. In many southern and rural states, where average incomes may be lower and several legislatures have resisted ACA expansion, enrollment dynamics reflect distinct regional pressures. Meanwhile, states with robust programmatic structures often show higher proportions of their populations receiving vital health and long-term care support through Medicaid and CHIP.
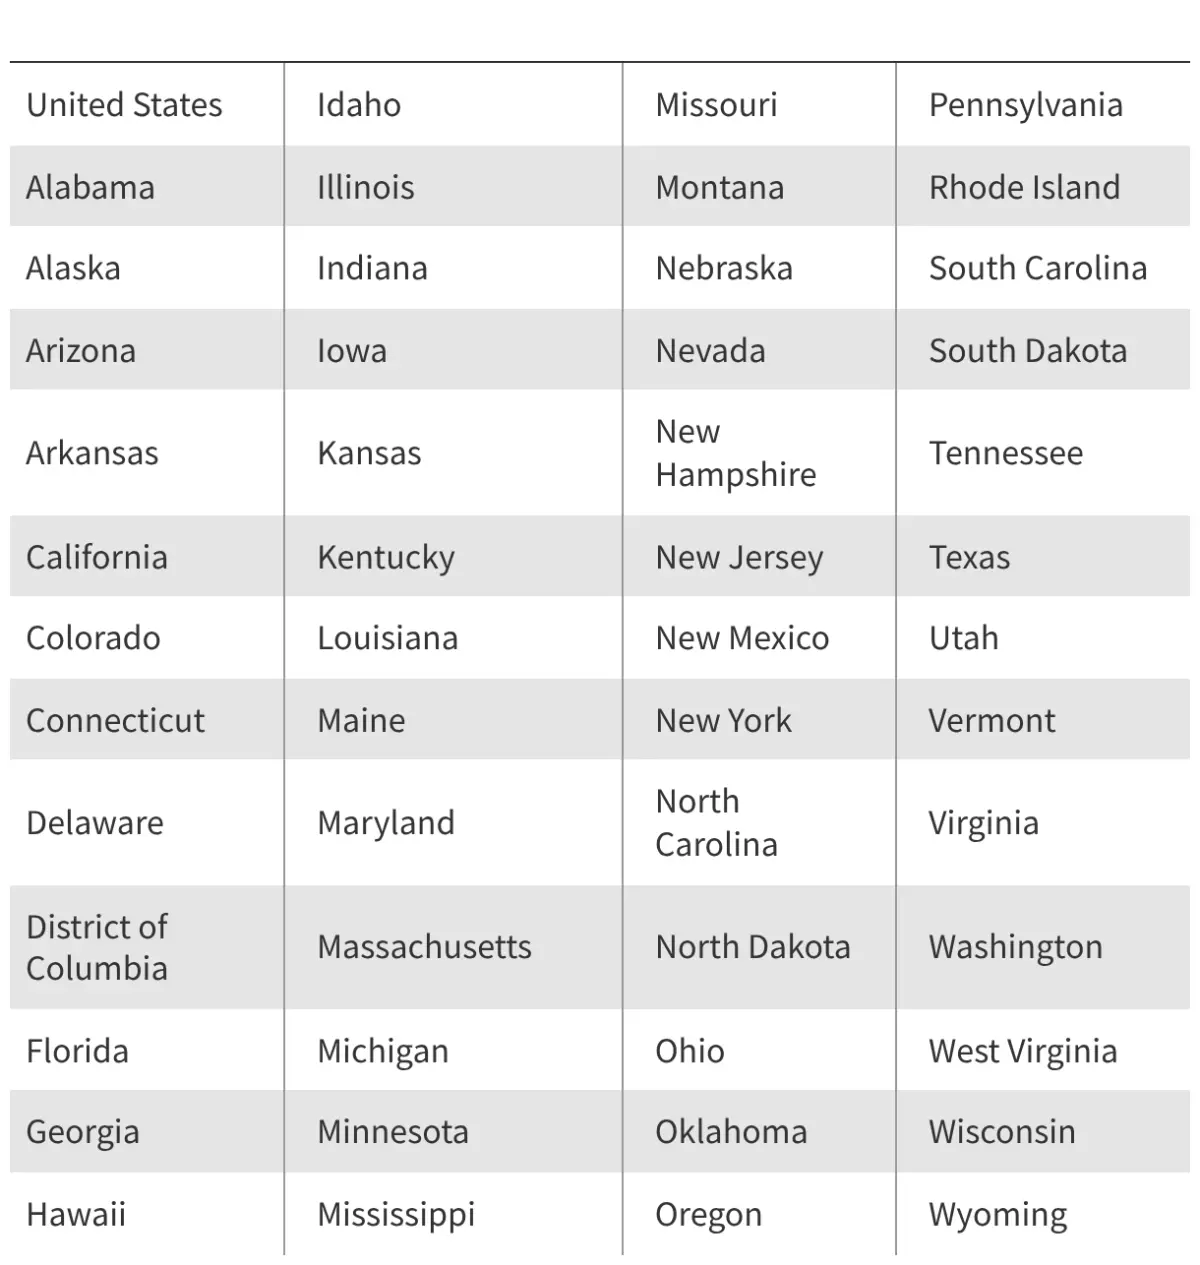
To help policymakers, researchers, analysts, and the public navigate this complex ecosystem, comprehensive fact sheets have been compiled for every state. These documents serve as a snapshot of key data, encapsulating enrollment numbers, expenditure distributions, and demographic profiles. Stakeholders examining the data can review how local eligibility levels compare against national medians and observe how uninsured rates among residents under the age of 64 fluctuate relative to state policy choices.
The Role of Comprehensive Data Sources and Research
The insights provided in the 2024 fact sheets and interactive mapping tools draw upon rigorous data collection efforts from leading health policy research organizations and federal reporting mechanisms. Total Medicaid and CHIP enrollment figures reflect ongoing tracking of monthly participation trends, capturing the shifting post-pandemic landscape of public health coverage.
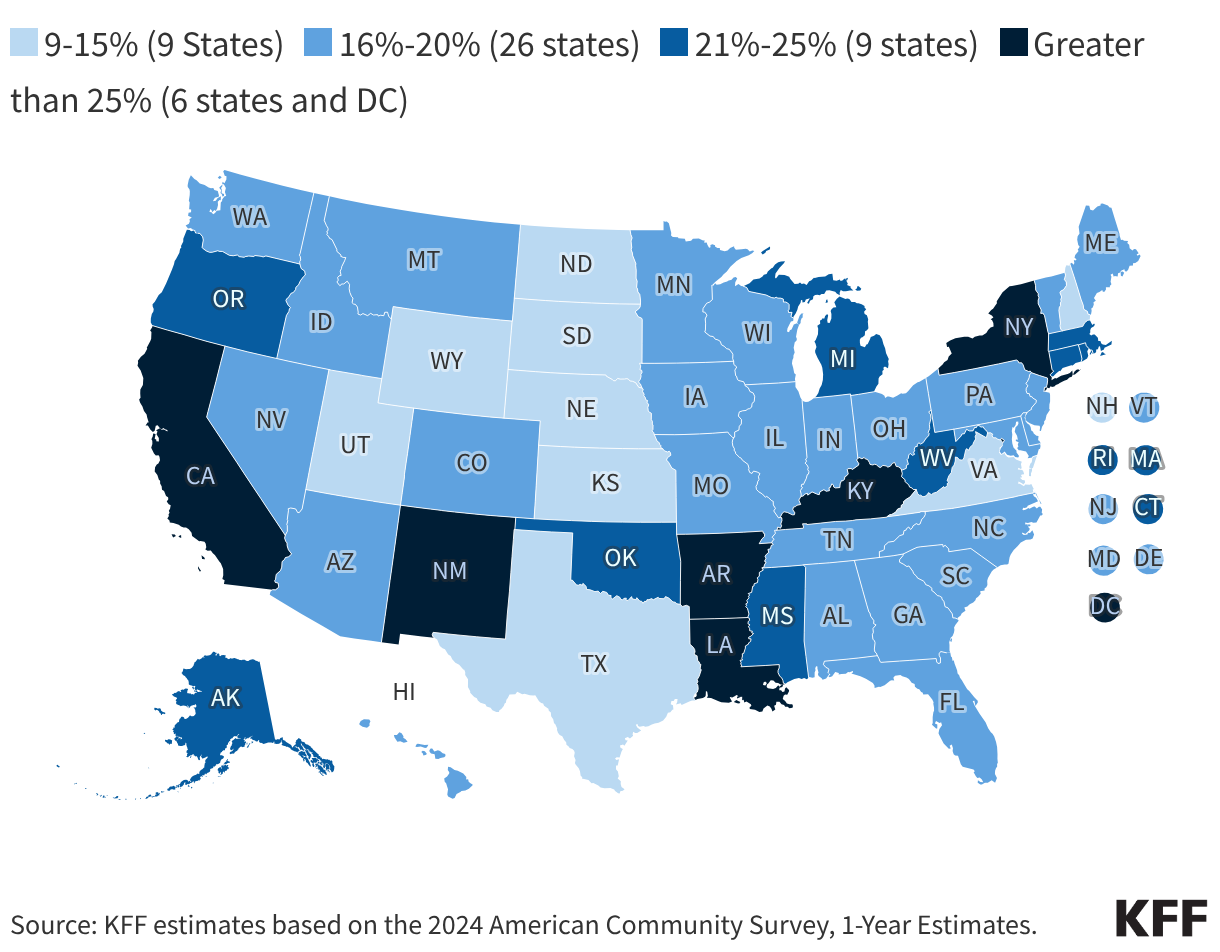
Furthermore, specialized resources—such as congressional district interactive maps—allow observers to examine Medicaid enrollment broken down by specific eligibility groups at a localized level. This granular view helps lawmakers understand how policy adjustments directly impact children, seniors, individuals with disabilities, and low-income adults within their specific jurisdictions. Additional metrics detailing the distribution of Medicaid spending illustrate where financial resources are directed, separating acute care costs from the substantial investments required for long-term services and supports, which remain a lifeline for aging populations and individuals with severe developmental or physical disabilities.
By synthesizing these diverse data points—ranging from overarching expansion status decisions to granular demographic characteristics and age-specific uninsured rates—the newly available state fact sheets offer a transparent, multi-dimensional view of America’s public health safety net. As states continue to navigate ongoing economic shifts, legislative debates, and the evolving healthcare needs of their residents, these detailed metrics remain an indispensable tool for understanding the state of healthcare access throughout the nation.











No comments yet. Be the first to join the conversation!